Media habits of the UK’s old and young revealed in new IPA report 

Key insights from the IPA’s Making Sense report on how media consumption is changing in the UK

Exactly half of all commercial media consumed in the UK is now digital, according to a new report from the Institute of Practitioners In Advertising and Facebook.

That figure has risen from 42% in 2015, and it’s not just the younger generation driving this trend, older people are spending a greater proportion of their time with digital media, too.

The change shift is more stark among 16- to 34-year-olds, however. Almost three quarters (73%) of the time this group spends with commercial media is spent with digital channels, up from 59% in 2015.

This age group also now spends on average more time each day with curated media, 8 hours 29 minutes, up 16 minutes on 2015.

Share of curated media time holds steady

There has only been a 1 percentage-point decrease in the share of time spent with commercial curated media among adults between 2015 and 2019, with the split now 65/35 in favour of commercial media.

Among UK adults, the five biggest commercial media properties by reach are: Facebook (64%), ITV (60%), Channel 4 (51%), YouTube (38%) and Channel 5 (33%).

It’s probably worth repeating that Facebook is sponsoring the report at this point. 

Reach is down for four of the five biggest buyable media types

According to the report, the five biggest commercial media channels are out-of-home, TV (commercial and recorded), functional internet, social media and commercial live radio, but all of these (apart from social) have experienced a decline in reach. 

The daily media cycle remains consistent

The media cycle of UK adults still follows mostly the same pattern that it did in 2015.

Audio platforms are still the primary media during the morning while video exponentially climbs from around 4pm until around 10pm, when it declines. OOH exposure remains relatively high and flat between 9am and 5pm.

In 2019, OOH was the largest media channel overall in terms of reach and time spent. But within curated media, commercial TV and social media combined make up over half of the media consumption for one day, at 57%. But while social media consumption is rising (up 5 percentage points to 23%) TV is declining (down 7 percentage points to 34%).

Smartphones take a larger share of device usage

There has been an even greater shift towards consuming media by smartphone, with the percentage increasing from 20% to 28% for all adults between 2015 and 2019.

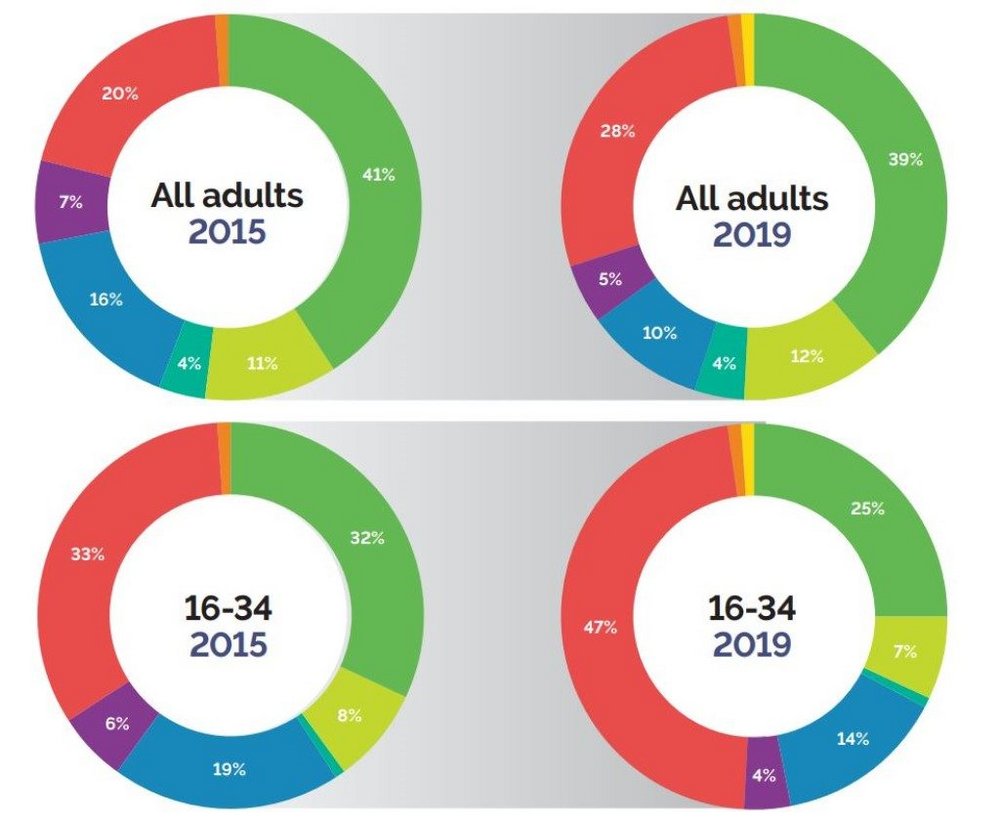
Smartphones’ growing share is coming at the expense of other portable technologies, such as tablets and laptops, both with consumption down 2 and 6 percentage points, respectively.

TV remains the most-used device among adults to consume media, standing strong at 39% with only a fall in 2 percentage points over the four-year period.

Despite the rise in popularity of voice technology and home assistants, these devices only account for 1% for 16- to 34-year-olds daily consumption of media, which is consistent across the other age demographics too.

Smartphones take on television

The 16- to 34-year-old market become much more reliant on smartphones. They spend more time on this device than any other and its share has increased 14% points, from 33% to 47%, between 2015 and 2019.

TV’s share fell from 32% to 25%, but it remains the second most used device among this cohort.

For those aged 55+ both TV and smartphone usage is on the rise, with TV increasing by 1 percentage point to 53% and smartphones up 6 percentage points to 10%.

This IPA Making Sense report was based on 6,000 participants, aged 15 plus, filling out an online questionnaire about their daily lives, and shopping and media behaviour and keeping a diary of their activities (every half an hour) for seven days. The participants also downloaded a dedicated app that monitored their mobile and tablet usage. The study compares the 2019 findings with two different IPA studies on the same topic, one from 2005 and another from 2015.

The full paper, which you can access here, contains an overview of the UK media consumption landscape, detailing when, where and how people are consuming media in 2019.


This article was downloaded from the Contagious intelligence platform. If you are not yet a member and would like access to 11,000+ campaigns, trends and interviews, email [email protected] or visit contagious.com to learn more.